

Aensora
I designed and developed Aensora, a website audit and reporting application. Once signed in, users can manage their websites, run scans, move from an overall score into individual findings and inspect the evidence captured from each page.
The work brings together application design, a Laravel backend and a React interface. It was also a substantial exploration of AI-assisted development: we wanted to test how frontier models could help build a complete system in Laravel, a framework we already had experience with.
The screenshots show the logged-in application using audits of my own website, captured in November 2026. Aensora is in beta, and its scoring rules and reports continue to evolve.

Laravel
Used

React
Used

TypeScript
Used

PHP
Used

Tailwind CSS
Used

Vite
Used
Goal
Give people a practical route from a website-wide assessment to the work needed on a particular page. The application needs to show the broad picture, help users narrow a large set of findings and keep the supporting evidence close to the recommendation.
Role
Design and development of the system in 2026, including the signed-in workspace, audit interactions, page-level reporting and the Laravel application supporting those workflows.
A workspace for each website
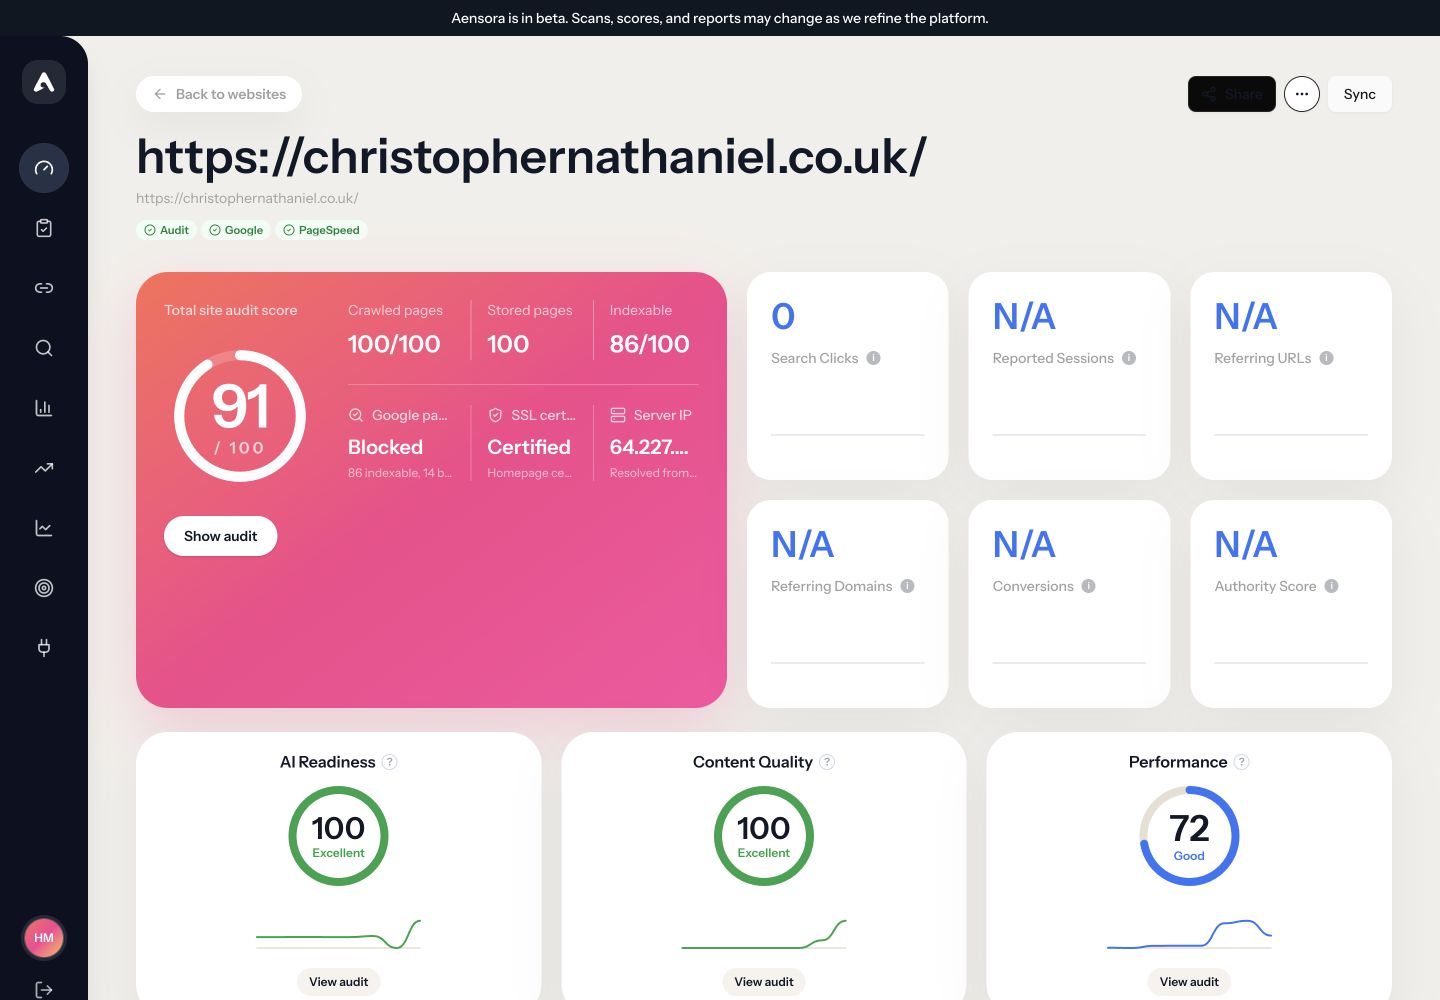
After signing in, users arrive at their website list. Each project brings together its crawl status, page count, audit score and issue totals. A website address and page limit provide the starting point for gathering pages, while existing entries lead back into their saved work.
Opening a website gives the user an overview of its current audit, captured pages and category scores. Search and traffic summaries sit alongside those results when connected data is available. A persistent navigation rail provides routes into the audit, visibility, rankings, traffic, goals and project setup, keeping the selected website as the shared context.
An audit that can be narrowed down
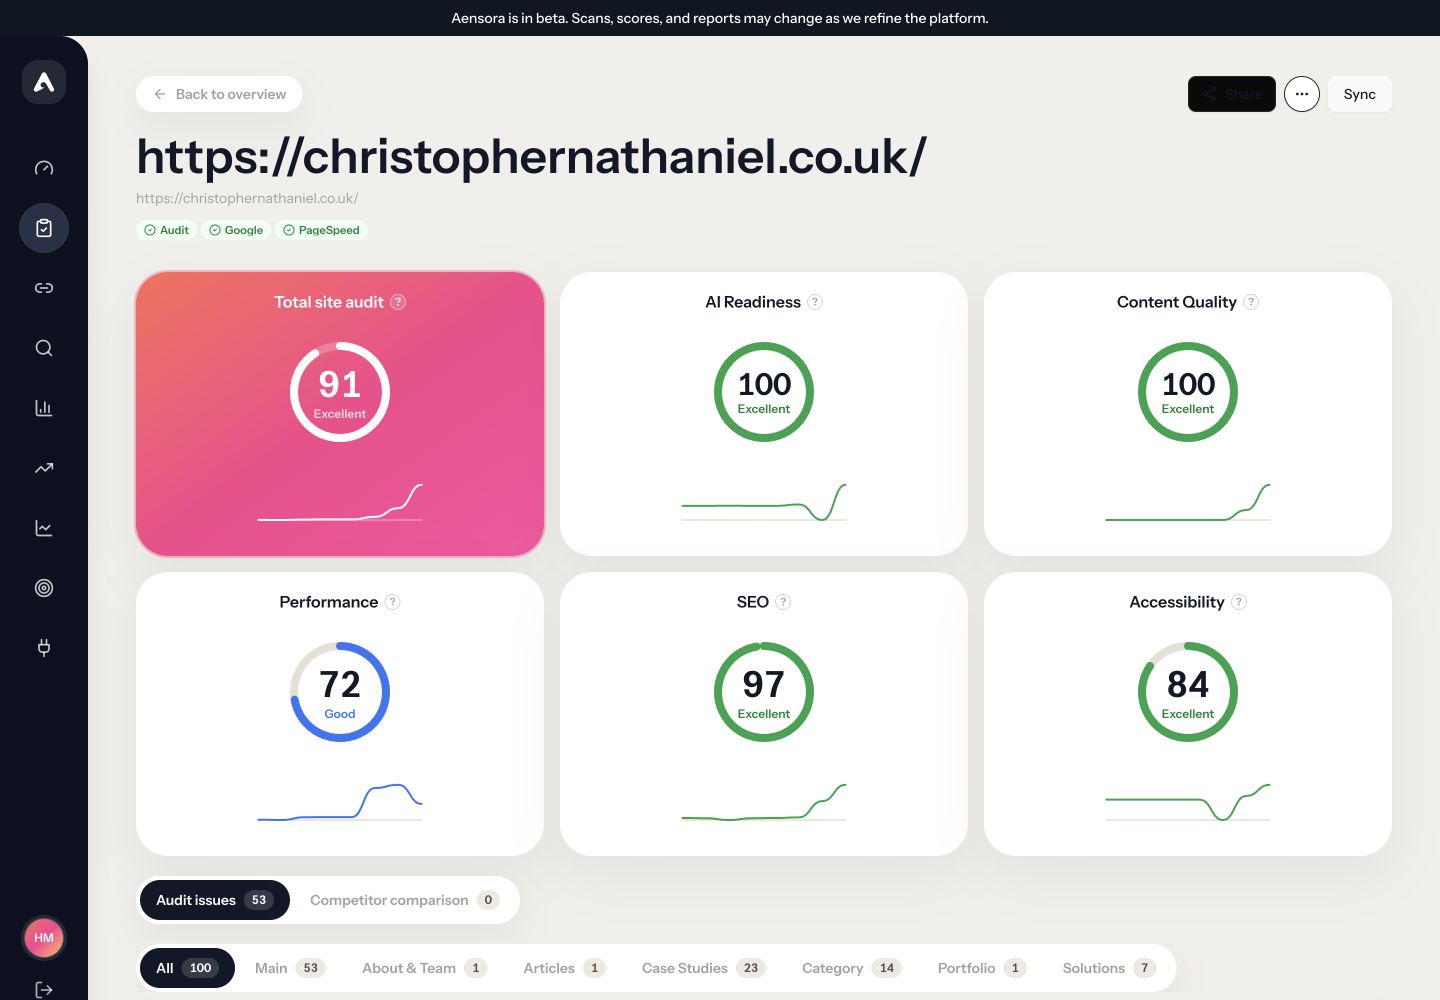
The audit view begins with the overall score and the category breakdown for AI readiness, content quality, performance, SEO and accessibility. Each summary includes a small history chart, giving users a starting point for investigating a particular area.
Below that overview, page groups, a page search and severity filters help narrow the results. A user can move between critical findings, warnings, notices and passed checks, then see the affected-page count and score for an individual issue. The same screen connects a high-level assessment to the URLs behind it.
From a finding to the pages that need attention
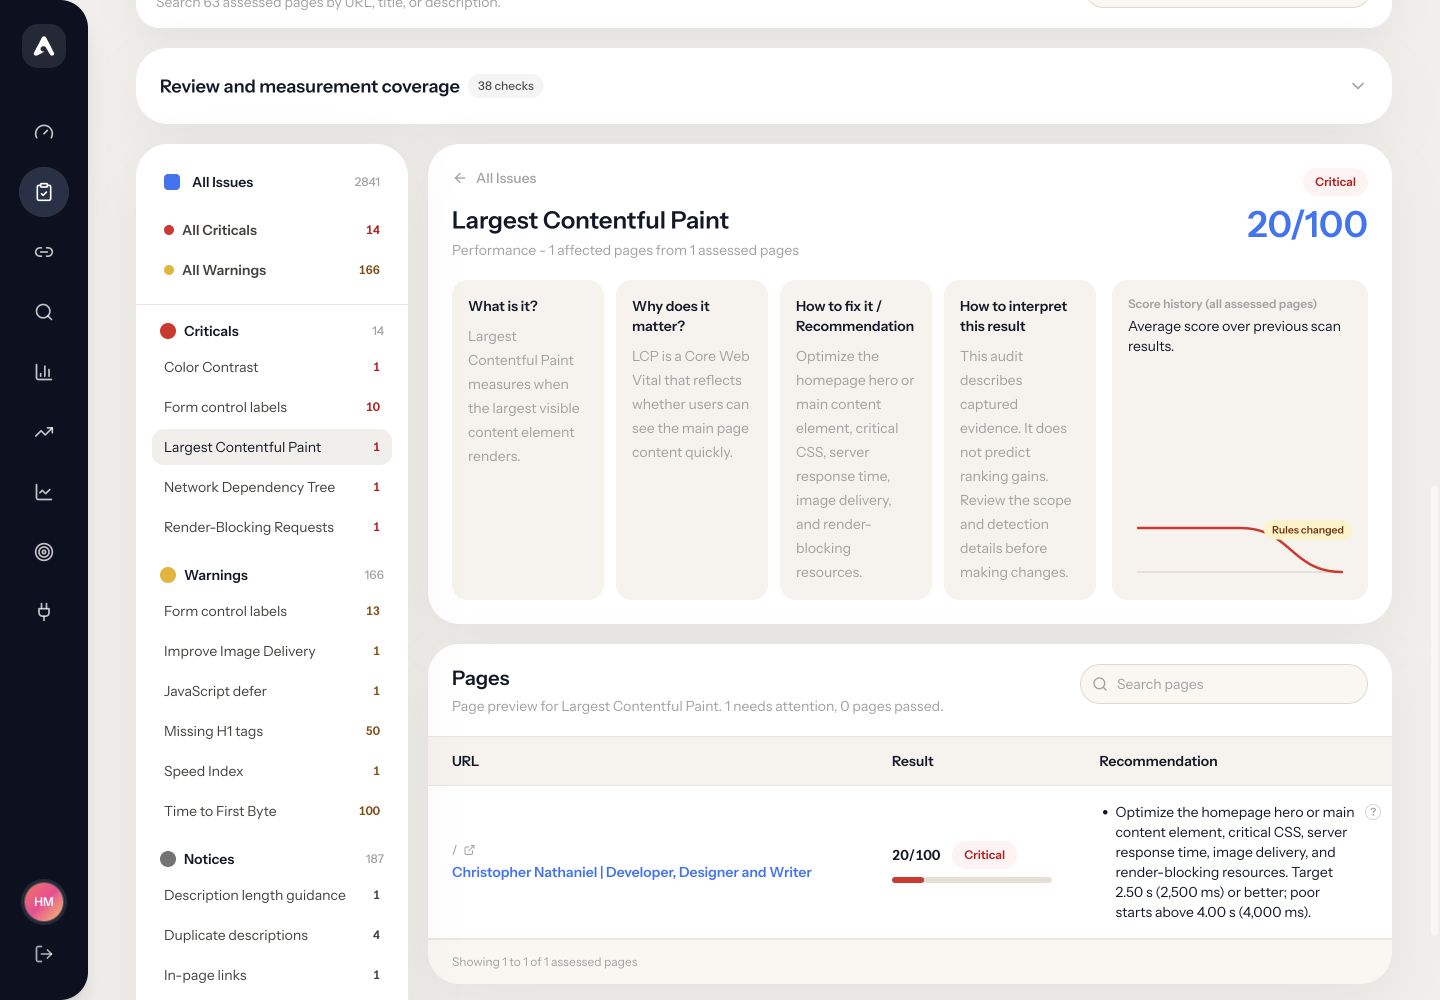
Opening a finding replaces the broad issue list with an explanation of the check. The interface sets out what it is, why it matters and the recommended action, followed by the pages assessed and their individual results. This gives a user a route from an unfamiliar technical term to the part of the website they need to inspect.
History stays beside that explanation. When scoring rules change between scans, the interface marks the change so an older result is not presented as a directly comparable measurement. The affected-page list then links into a dedicated workspace for each captured page.
A page-level workspace for reviewing checks
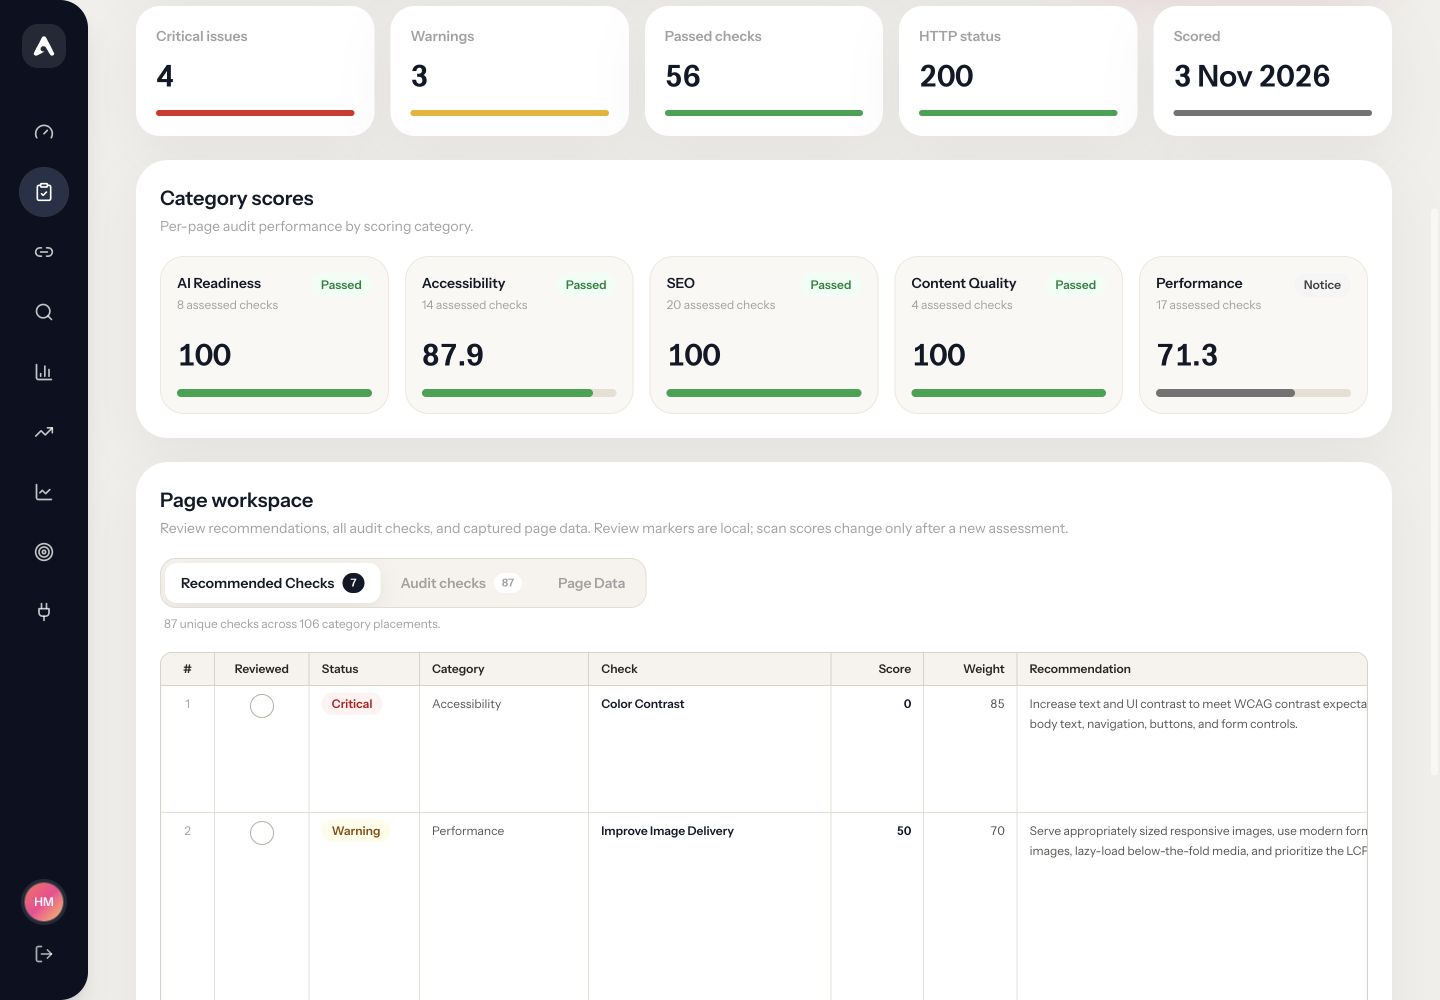
Within a page, the user can review its title, description, response status, score and category breakdown before moving into the detailed checks. Recommended Checks brings the items needing attention together, with status, category, score, weighting, recommendation and evidence in the same table.
The Audit checks tab exposes the wider set of checks, including those that passed. Local review markers help someone work through a page without changing its measured score; a new assessment is what updates the audit result. Keeping that distinction visible separates the act of reviewing work from the evidence that it has changed.
Keeping the captured evidence available
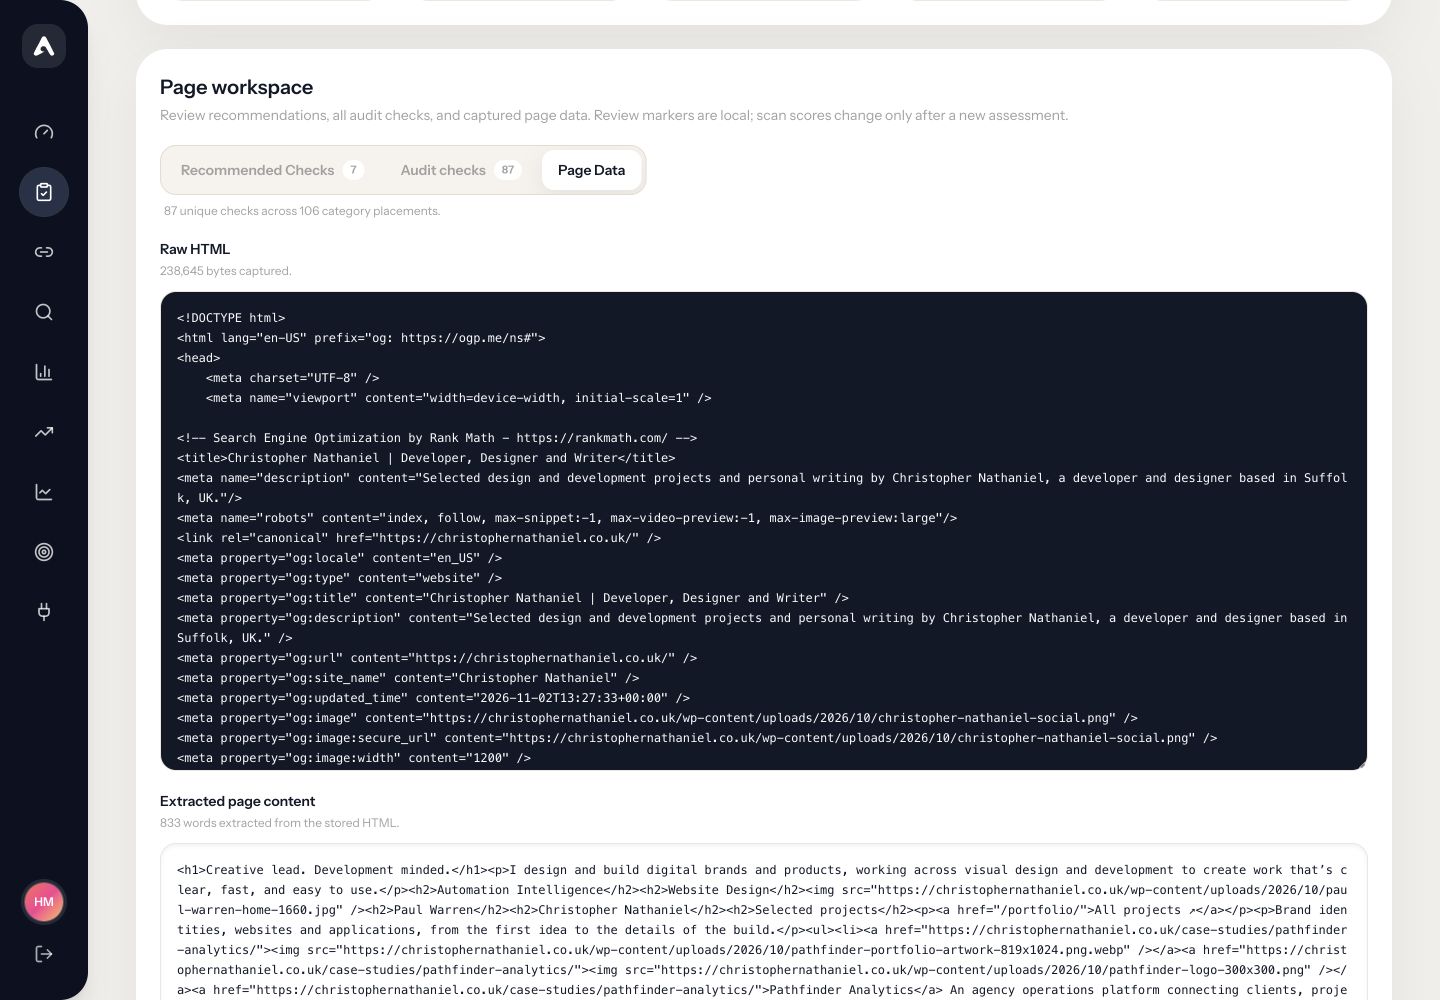
The Page Data tab exposes the material behind the assessment: captured HTML, extracted page content, extracted fields and response metadata. A developer can inspect what the crawler actually received when a recommendation needs more context.
This detail is loaded when the user opens the tab. It keeps the normal review screen focused while providing a deeper view in the same page workspace, without asking the user to leave the audit and reconstruct the evidence elsewhere.
Controlling the scope of a scan
Project settings bring the website’s client label, default scan amount, schedule and query-string handling into one dialog. The owner can choose a bounded crawl depth and decide whether parameterised URLs should be excluded, keeping filters, tracking links and search variants from consuming the scan allowance.
These settings sit within the selected website rather than a separate administration journey. The application also keeps scan work separate from opening reports, with sync controls available when the user wants to refresh the stored information.
Connected services with a clear status
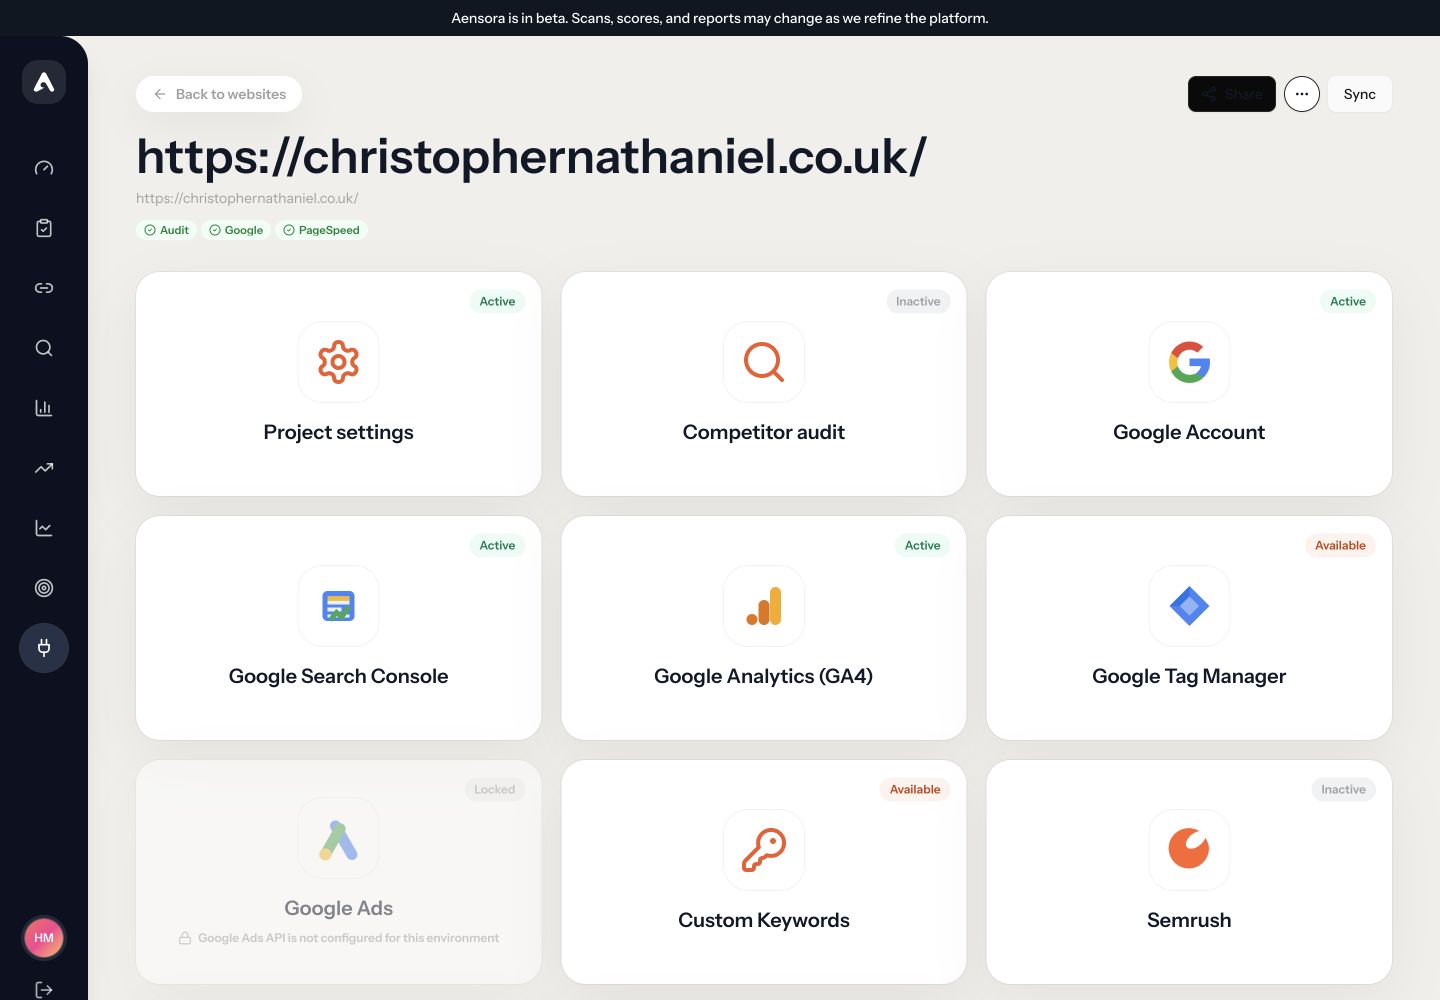
The Setup screen groups the project’s service connections and reporting options into cards. Active, inactive, available and locked states show which parts are ready and which need configuration. Google Search Console, GA4, PageSpeed and other provider options remain attached to the website they describe.
The reporting views distinguish audit findings from search, traffic and provider measurements. They work from stored snapshots, with the selected date range and sync state providing context. Unavailable figures remain marked as unavailable, so an unpopulated report is not mistaken for measured activity.
A modular Laravel backend
Laravel and PHP handle website ownership, scan jobs, captured page records and score processing. Crawling, evidence storage and scoring are separate parts of the application. Individual PHP score modules define their checks and explanatory metadata, while shared processing assembles the results into category scores.
React and TypeScript render those results through a common interface, connected to Laravel with Inertia. This makes the audit screens reusable across different checks. New scoring logic can supply the same kind of result and evidence structure without requiring a new interface for every metric.
Exploring frontier AI through a complete product
This was a substantial AI project because the experiment extended across a connected application: persistent records, background work, detailed interfaces and reporting workflows. We wanted to understand how frontier models could help build that system within our existing Laravel experience.
Working in a familiar framework gave the exploration a practical foundation. The application still needed a coherent structure and a useful sequence of decisions for the person using it. Aensora brings that technical experiment into a product where a user can move from a website address to the evidence behind a specific recommendation.